At the beginning of every month, I project a path of broad market direction based on Average True Range (ATR), seasonality, cycles and current conditions.
The idea isn’t to be spot-on accurate… The idea is to have a plan to make money regardless of market noise, naysayers and what sometimes seems like nonsensical, national near-sightedness — even if it isn’t.
Hindsight Is Always 20/20, But…
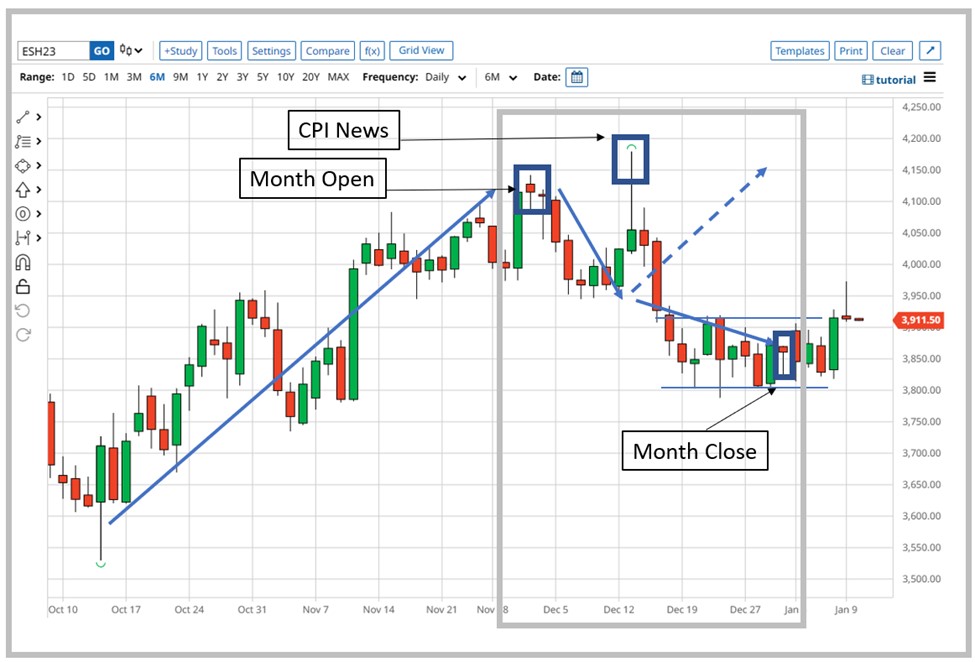
December followed its seasonal tendency of moving in a downtrend the first half of the month into the November Consumer Price Index (CPI) data drop. What it didn’t follow was its seasonal tendency to float up the second half of the month (dotted arrow in the chart below).
Instead, it continued the path down, crushing the “bulls hope for a rally” narrative.
Then again, let’s take a deeper look… Because what you decipher might help with your future trading.
The Market Isn’t Just What It Seems
In reviewing the chart above, the swing high accomplished off the hot CPI news reached a weekly ATR and month goal with practically no effort. Obviously, it didn’t hold, and the market fell off the tracks that one historic day before another historic day, the Dec. 14 Federal Open Market Committee’s latest meeting and 0.5% interest rate hike.
But still, price went where price went — and all I’m saying is I take note of ATRs.
With volatility in high gear, the market accomplished several other feats worth noting…
For one, Dec. 1 marked the top of an approximate six-to-eight-week run, shown in the chart above. That was a nice swing trade rally. Yeah, yeah, I know — a “bull trap” the headlines said with confidence as I took money to the bank.
From a mere price action standpoint, however, that was a difficult “top” to “top” in a bear market.
Adding to the tough conditions, it came at the month open — a key time and a key number… It’s like the market ran a marathon for six to eight weeks, crossed the finish line with grand applause… and then was told to start running the next marathon.
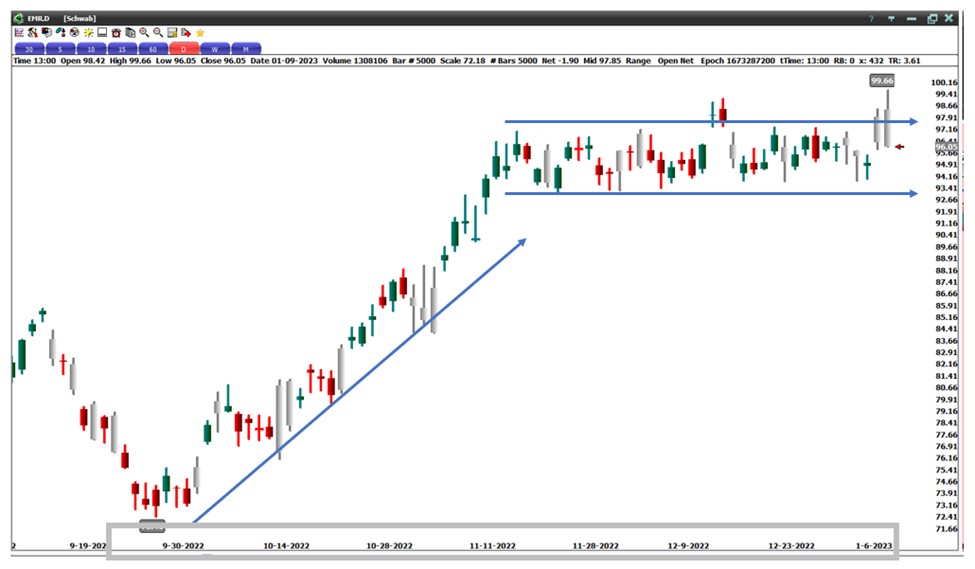
It might be helpful to understand that institutional accumulation was practically all in as far back as September, when certain strong stocks started their marathon run.
One simple example is Emerson Electric Co. (NYSE: EMR). And it’s taking a rest after the strong run. Where will it go next?
Facts Are Stubborn Things
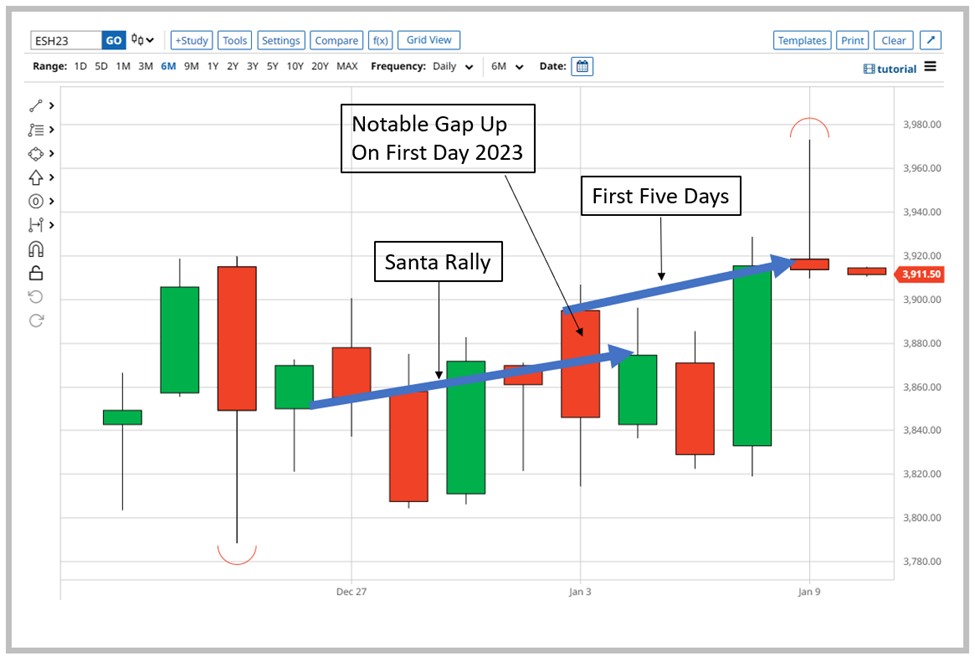
It’s just a fact that the broader S&P 500 market managed to squeak out a slight Santa rally in December despite the Grinch. And it held its lows, which were higher than November’s lows. You can see this in the chart below (Dec. 23-Jan. 4).
Looking at the same chart, it’s also worth noting that the first five trading days of 2023 just closed positive.
I have to admit, I was skeptical on the first day of the trading year about the market’s ability to achieve another rally, but then it gapped up strongly.
“I don’t know how this bear market could possibly move higher under this condition,” I said to myself that Sunday night when futures surged. “But anything is possible, and it will tell me — I just have to be patient.”
The condition I’m referring to is not the 2022 bear market… It’s the difficulty of both getting back to the opening price, and getting above it based on recent trading.
It’s similar to the overbought conditions on Dec. 1, but in a smaller time frame. It took some serious work to accomplish this over the first five days.
Again, it’s price. I’m just saying I took note.
Where Do We Go From Here
Simply based on the two trends shown in the chart above, the probability of January ending higher is strong based on historical evidence. That doesn’t mean it will, it’s just an argument for a higher close.
That’s January, not February, not March — one month at a time.
What’s important is having a plan to make money and protect capital.
Which brings us to January… What will happen next?
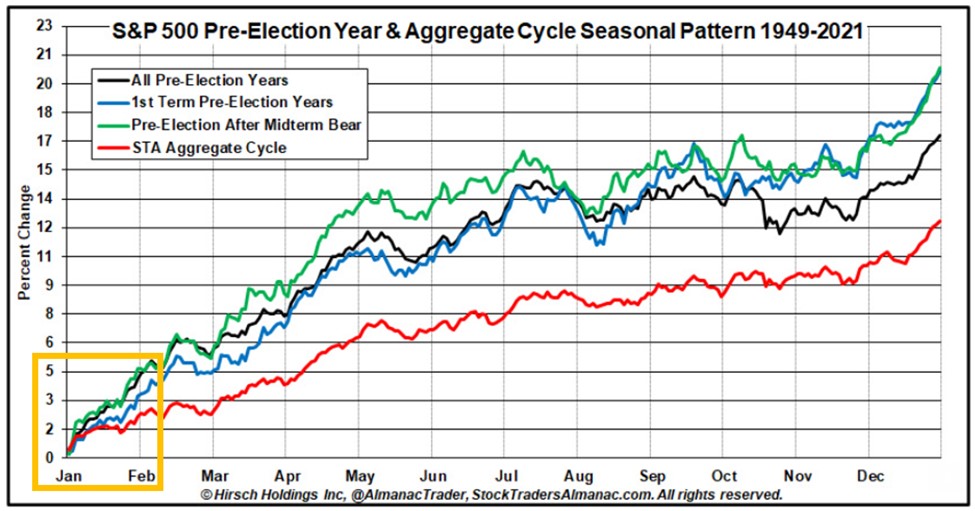
One of my favorite cycles is the Presidential Cycle. I know how to use it to give me an edge. That’s the key, and it’s what many miss.
Here it is, straight out of the Stock Trader’s Almanac…
Is it possible? What will push us there? What sectors will outperform if the broad trend is up?
If it’s possible, how will it get there?
Well, not in a straight line.
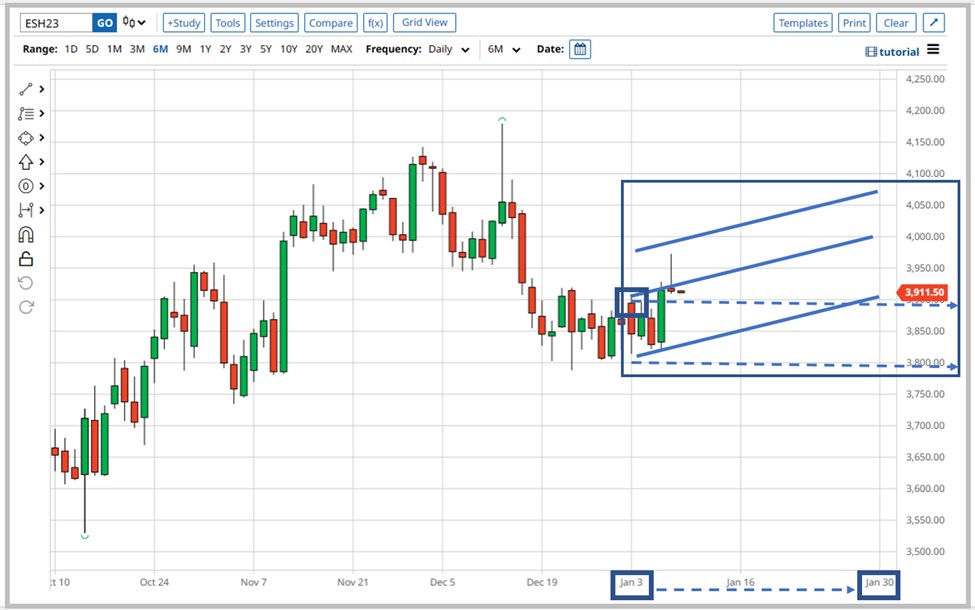
Here’s how I’m looking at January — the hard-right-edge rectangle shown below. Among other things, I’ll watch for breaks in support, and evidence in price as a contradiction to projection, particularly if it approaches November and October lows.
My No. 1 goal is to take green to the bank. How will I get there?
Well, again, not in a straight line.
It will be recorded, reviewed and then used to rationalize February.
I hope this helps your January focus. The market is full of curves. Face them straight on and trade to trade well.
To your success!
Celeste
On the Go Investing
P.S. The Key Time to Trade During Earnings
Everyone who’s traded for any amount of time knows that earnings reports are a BIG deal each quarter.
But did you know that after certain reports, there’s a unique 72-hour window that real professionals know is the key time to trade during earnings season?
This three-day period is when stocks could move the most — regardless of the overall market!
Legendary trader Tom Busby and Senior Strategist Roger Scott believe they’ve cracked the code to tap into this unique earnings drift phenomenon…
And they’re holding a special live presentation at 1 p.m. today, Jan. 10, to share all the details on this breakthrough earnings strategy, right at the start of earnings season!


