A key to remaining calm and protecting capital in any market is having a plan, even if it didn’t work out… Or did it?
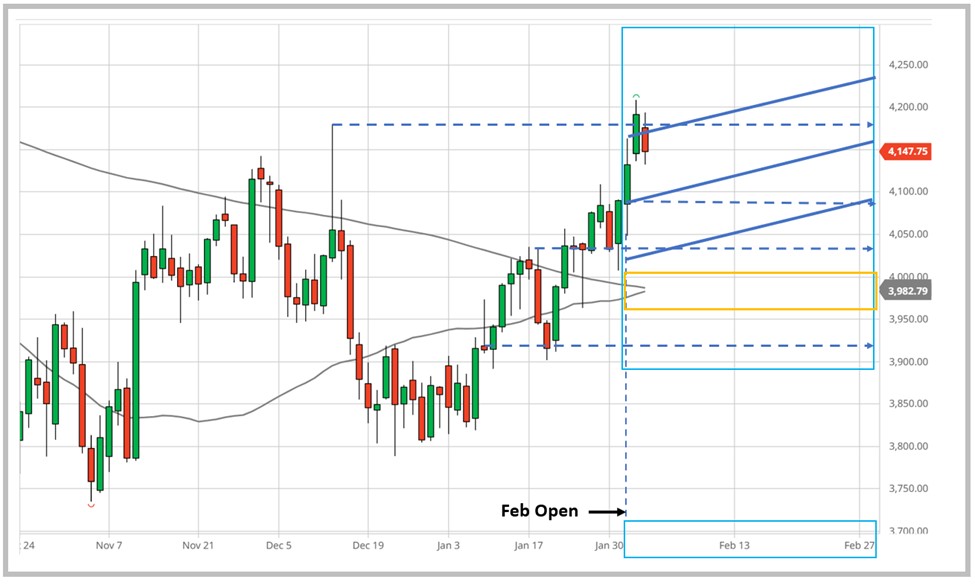
One unusual component of my S&P 500 plan for February 2023 was the impact of a strong January off of a bear market that was contrary to what most expected. When this happens, as it did in January, February often closes higher.
On the flip side of my February plan was the 200- and 50-day moving average crossover at a major support area. The yellow box below drew attention to it.
All in all, the projection of my plan looked like this:

After Presidents Day on Feb. 20, the market was bombarded with unwelcomed Consumer Price Index (CPI), Producer Price Index (PPI) and Federal Reserve news. February’s second half then made history for its price action.
Note the response to the month open (blue highlights).
Note the response to the dotted line (more blue highlights).
Finally, note the month close right between the 200- and 50-day moving averages spread.
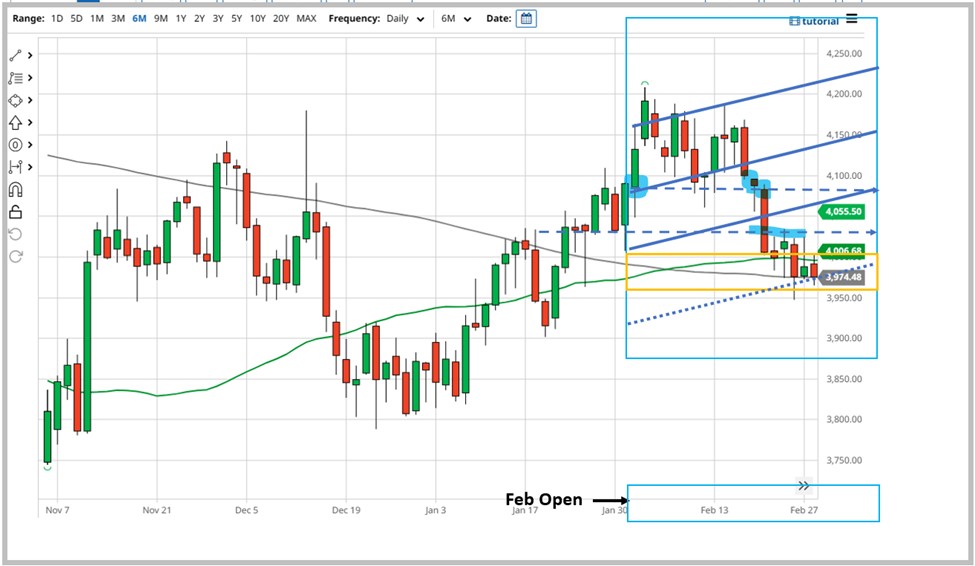

Why is this important?
Here’s what I wrote last month:
If February closes strongly to the downside after the recent December and January move in price action, then thoughts on a solid first quarter or year end must be reconsidered. In other words, the trend in place from October needs to be reevaluated.
March is next.
The first four days have shown constructive strength. With Fed Chair Jerome Powell speaking twice this week, I don’t expect that to last… assuming his personality hasn’t changed.
Pandemic-driven economic repercussions continue to resolve, as displayed in the data, giving hopes of a stronger March. While not thrilling to live through and often questioned, less bad news has a way of lifting the market.
Caution remains, however… For one, the 200- and 50-day moving average spread is still very much in play for March.
Keep this in mind — this is very important…
The major support occurring right now because of the two moving averages does not last forever. History is revealing. Check it out for yourself and decide how you think this will play out, and when.
Another area that has my attention in the short term is the orange box where mid-month CPI, PPI and Fed news come back into play.
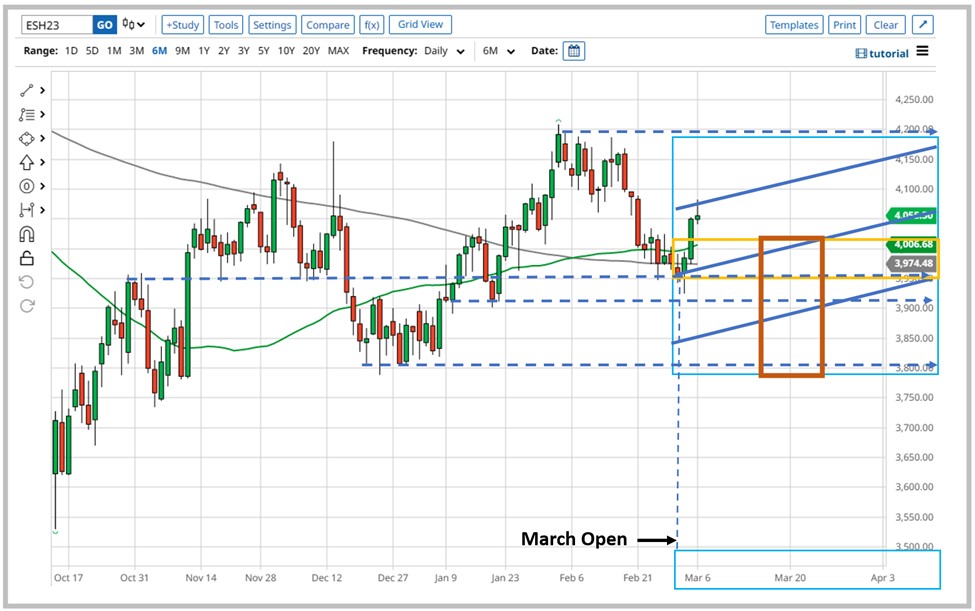

All this to say: March winds can be volatile.
Trading with multiple strategies remains key in Q1. Doing so will likely give you insight into the summer months ahead, which is a very important topic we’ll revisit soon.
Think and win!
Celeste Lindman
Celeste Lindman Trading
P.S. US EMERGENCY: Oil Inventories at Lowest Levels Since 1983 — No. 1 energy play
Oil inventories are the LOWEST they’ve been since 1983 here in the states… And another massive surge in energy prices is looming… So Jeff Zananiri is going LIVE at 1 p.m. ET TODAY, March 7, to break down his No. 1 “Supercycle” energy play!
Not only will he hand you his top play for free… But he’ll also show you the hedge fund trick he uses to find these plays…
The same strategy that returned:
- 218.87% on EEM in 30 days.
- 146.76% on IWM in 42 days.
- 35.14% on UBER in 19 days.
So Make Sure You Register Here!
Past performance is not indicative of any future results. Trade at your own risk. From 1/1/22 to 3/6/23 the win rate is 63.6% on the stock, the average return per trade on options is 8.44% (winners and losers), and the average winner is 138% with an average hold time of 31 days.

