For the last few days, I’ve been explaining that markets are starting to break down.
It’s been a fascinating downturn since last Thursday, February 2.
Remember last week? Everyone sat in the room saying that the Federal Reserve failed to send a message to the market.
Remember when they ignored Fed Chair Jerome Powell’s relatively hawkish tone or the fact that Minneapolis Fed Bank President Neel Kashkari’s statements that we might need to move to 5.4% this year?
Well, Powell did send a message to the market. You just missed it.
Under Pressure
When we look for the possibility of a selloff, we always start when the market is euphoric. Last week, the entire narrative centered around soft landings, Fed pivots, and missing a recession.
The narrative is shifting. But not for any of these reasons.
As you can see in the chart below, the Relative Strength Index (RSI) on the daily chart peaked at last Thursday’s trading session. The same appears to have occurred with the Money Flow Index (MFI) as well.
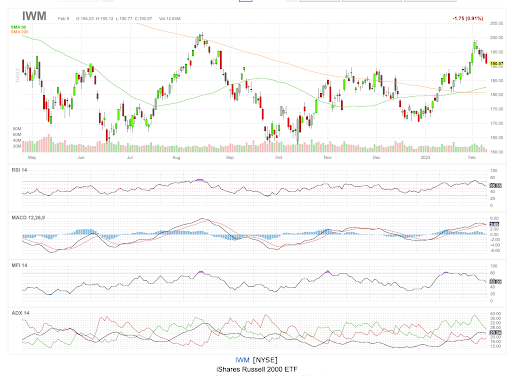
The MACD looks ready to turn, and the ADX’s strength trend seems to be weakening. This is all a sign of money leaving the markets – and the possibility of a HUGE shift in short-term market sentiment (or profit-taking.)
I don’t find it coincidental that last Thursday was the short-term top.
As I noted the other day, the Federal Reserve started a full-court press.
And while everyone said that Powell didn’t signal a hard enough move on rates and this rally, the Fed quietly engaged in a sneak attack that may have stopped this rally in its tracks.
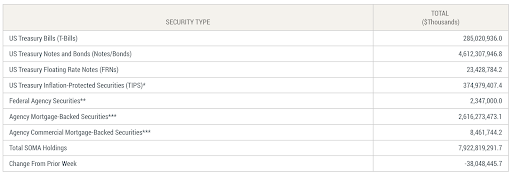
The Fed cut its balance sheet by $38 billion last week.
$38 billion.
Understanding the Fed’s Balance Sheet
Each week, the Federal Reserve conducts Open Market Operations on its balance sheet. Sometimes it buys bonds. Other times it sells them.
But for the last year, the Fed has been enduring a process known as Quantitative Tightening. That consists not just of raising interest rates (which is the only thing that seems to be on people’s minds.)
It also consists of cutting the balance sheet.
Here’s the System Open Market Account (SOMA) report for last week. As you can see, the Fed owns about $7.9 trillion on its balance sheet.
And all of that liquidity the Fed has provided to the markets over the last decade has found its way into the equity, housing, and bond markets.
But now, the Fed is cutting its balance sheet. It’s selling assets and reducing liquidity in the system. Last week, the Fed drained $38 billion from the system – while everyone was celebrating “peak rates.”
This was a mistake.
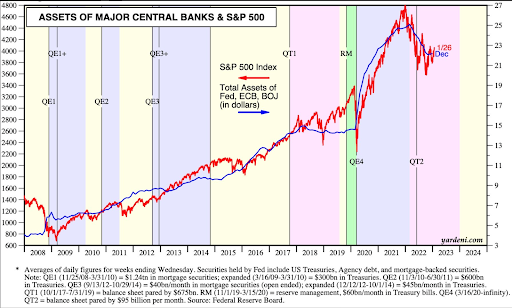
There is a direct causal relationship between the Fed’s balance sheet (and the balance sheets of the Bank of Japan and European Central Bank) and the S&P 500.
Drain capital from the system, and you’ll hit stocks.
The Fed plans to cut $1 trillion from its balance sheet this year. Do the math and consider what this can do to risk assets and P/E ratios. The academic evidence is rather compelling.
The Fed will release its SOMA report today at 4:30pm, and based on the way that the market is reacting, it feels like Mr. Powell is still sending a message.
I have a feeling that my relative momentum indicator will flash VERY soon. We’re already at yellow, and this market could take a big hit if the selling continues.
To your wealth,

Garrett Baldwin
Market Momentum is Yellow
Buying momentum is plunging and we’re about to go Yellow on Momentum. This market is now facing significant short-term pressure from overbought conditions last week. Now is the time to start playing some defense in a long-term portfolio or look for the best ways to trade negative momentum if the market does begin to tank. I’ve covered you over at Tactical Wealth Investor, where I give away a free copy of “How to Trade Negative Momentum.” This is the most important report you can read all year.


