I’ve been doing an awful lot of talking about techniques for short-term trading lately. So I thought I’d share one of the best indicators for short-term trading strategies…
If you want to learn about my absolute favorite indicator for trading, go here!
The Relative Strength Index was invented by J. Welles Wilder in 1978, and it’s featured in his book “New Concepts in Technical Trading Systems.” It’s a momentum oscillator that measures the speed and change of price movements.
The RSI oscillates between zero and 100. It’s considered overbought when above 70, and oversold when below 30.
I will spare you the long explanation of how to calculate the RSI because it’s available online, so there’s no reason to calculate anything by hand.
Luckily for us, the only thing that needs to be adjusted is the time period…
Wilder usually used 14 days to calculate the RSI oscillator, while I prefer to use a shorter time period.
I find that the 10-day setting works better for short-term market swings, so that’s the only thing that you’ll want to change when using this oscillator.
The Best Indicator for Short-Term Trading: Leading and Lagging Indicators
The best indicators for short-term trading can be divided into two categories of indicators: leading and lagging.
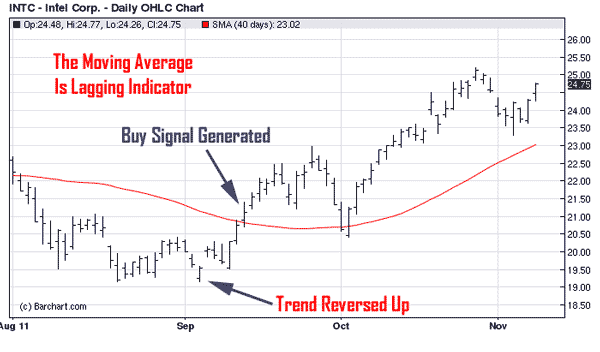
Lagging indicators confirm and follow price action.
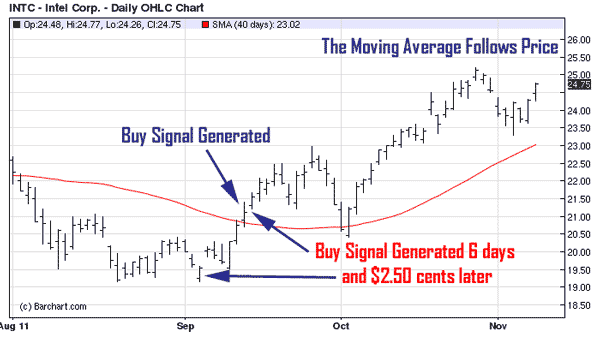
For instance, a moving average tracks and follows the price trend, providing information to traders after the fact. Lagging indicators are commonly called “trend following” because they’re designed to get traders in and keep them in as long as the trend is intact.
But these indicators aren’t effective during sideways markets…
Another disadvantage to this kind of indicator is they’re lagging and provide direction after the fact. They may cause you to get into a trend much later and after the initial signal was triggered.
However, they’re considered one of the best indicators for short-term trading strategies for trend following.
Leading indicators, on the other hand, are designed to lead price movements. In other words, they’ll give a signal before a trend or reversal has occurred.
So the leading indicator provides some benefits as well…
Early signaling for entry and exit is the main upside to using leading indicators, which also work best in choppy or trending markets. But if used in trending markets, it’s advised to only use them in the direction of the major trend.
If the market is trending higher, I would only take long trades using the RSI. And if the market is trending downward, I’d only want to trade stocks short.
The Best Ways to Use the RSI
The best way to use oscillators, such as the RSI, is to measure short-term, overbought and oversold levels in choppy markets.
This is where these indicators thrive.
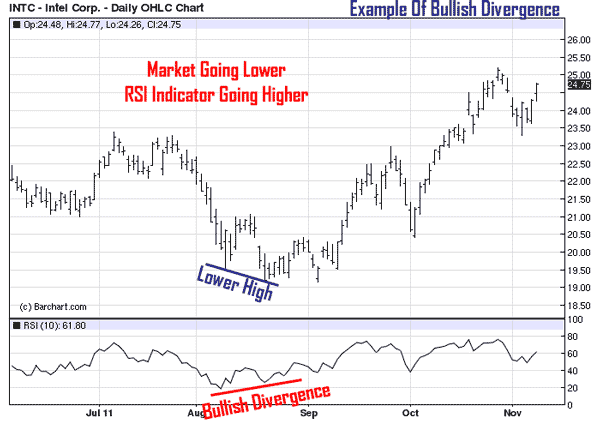
One of the best ways to use the RSI is to measure for divergences between the market analyzed and the indicator itself.
A bullish divergence occurs when the underlying stock or any other market makes a lower low, and the RSI forms a higher low. RSI does not confirm the lower low and this shows strengthening momentum.
A bearish divergence forms when the stock or market you want to trade makes a higher high, and the RSI forms a lower high. The RSI doesn’t confirm the new high and this shows weakening momentum.
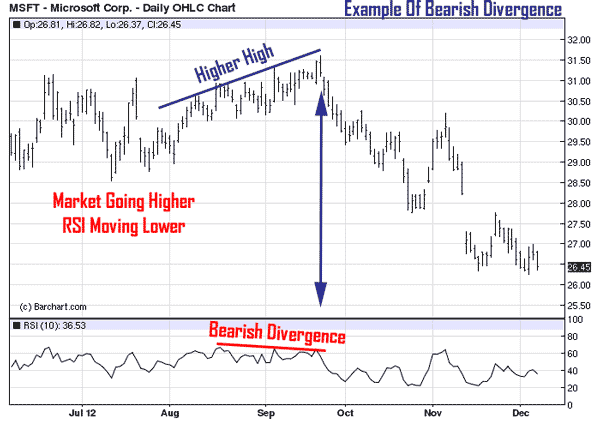
You can get a pretty good idea of how the RSI generates trend-reversal signals by looking at these examples.
But the most important thing to remember about using oscillators such as the RSI is the fact they only work well in range-bound or choppy markets.
Markets that are trending typically respond much better to trend-following indicators like the moving average.
I wouldn’t use a moving average in a choppy market. It’s the quickest road to disaster, so make sure to check the general slope or direction of the trend before applying these indicators.
But still, the RSI is one of the best indicators for short-term trading strategies.
And once again, to learn about my absolute favorite indicator for trading, you can find more info here.
I’ll post more tutorials on short-term trading systems and indicators in the next few weeks. But for now, please go to these other articles for more on this topic: A Beginner’s Guide to Stock Sector Analysis and Relative Strength and The Best ETF Swing Trading Indicators for Beginners.
And if you haven’t done so already, subscribe to our YouTube channel so you can be notified as soon as we make our next post, and see what trade opportunities we’re paying close attention to!
All the best,
Roger Scott
Senior Strategist, WealthPress
P.S. Sharing My Secret… How to Trade ‘The M-Spike’
I hosted a live bootcamp session Thursday that I believe was one of the most content-rich workshops of my career.
Unfortunately, a lot of people weren’t able to attend…
So I’m offering a chance to catch the replay one more time, at no cost!
Watch the session here!
In the bootcamp, I dove deep into:
- The five most popular indicators.
- The “M-Spike” and how to spot it on your charts.
- The research behind the “M-Spike.”
- A list of top 12 performing tickers for “M-Spikes.”
- “M-Spike Bull versus M-Spike Bear.”
- The Four-Day Flip strategy.
I can assure you, it was a session not to be missed!
Learn How I Trade ‘The M-Spike’ Here


