Everyone needs a few different chart patterns for beginners to focus on when they first start out trading.
Most people learning how to trade start with what I call an “indicator fascination.” They dive right into advanced analysis methods that confuse and oftentimes discourage them from continuing to trade.
When I first started out, I was under the impression that the more difficult methods would produce a higher probability of winning trades.
I purchased several books and magazines that discussed Gann Lines, Geometric calculations and Elliot Wave Principles that required a Ph.D. in physics to understand. I can promise you the only thing I learned after following these methods was to stay as far as possible away from them.
Why Chart Patterns for Beginners Should Be Simple
Fortunately, I met a few professional traders who mentored and showed me some simple chart patterns for beginners that got me on the right track. And more importantly, they made me understand that trading isn’t all about complex and confusing strategies…
It’s about finding methods that match our emotional make-up and risk tolerance.
So today, I’m going to show you a few basic chart patterns for beginners that should help you get started on the right track.
Always Begin With Daily Chart Patterns
The most fundamental mistake beginners make is searching for chart patterns that use intraday time frames.
I always encourage traders to begin their analysis with a daily time frame and then move on to the intraday time frame right before they’re getting ready to enter the trade.
There are some markets, such as E-mini S&P 500 futures and Forex, that you can begin analyzing using hourly or shorter time frame bars. However, most financial instruments respond best to daily chart analysis to begin with.
You can see just that in the symmetrical chart pattern setup below…
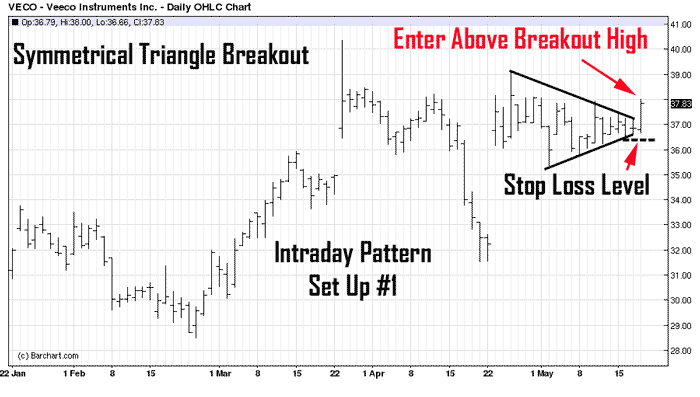
I want to wait for the initial breakout to occur so I can day trade if the stock’s momentum continues after the breakout.
Usually, after a tight symmetrical triangle, the stock is wound up and ready for strong momentum that can last two to five days.
You’ll also notice that I completely relied on the daily chart for my analysis, entry and exit.
I watch the intraday chart while I’m in the trade, but I mostly focus on the daily chart to make sure the pattern is developing.
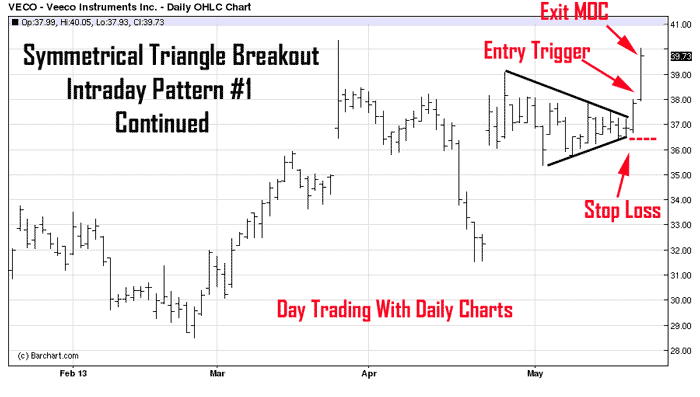
In the next case, the triangle breakout continued its upward momentum and closed near the high of the day.
I would use a simple market-on-close order to liquidate the position at the end of the day.
What I like about triangles is the inherently limited risk due to lack of volatility while the pattern is setting up.
This is one of the reasons why triangles are good low-risk, high-reward chart patterns for beginners.
The next low-risk day trading chart pattern I want to show you is the bullish flag pattern.
It’s similar to the triangle pattern, but it has a slightly wider channel range and typically slopes down a bit more.
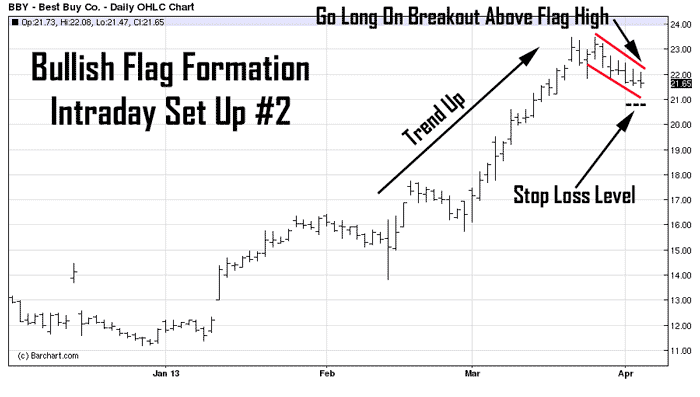
Notice the risk level is equal to the size of the bars that make up the flag.
I would look for a strong breakout day outside of the flag for an upside entry.
Flags are congestion patterns that tend to explode with good momentum once the congestion phase comes to an end.
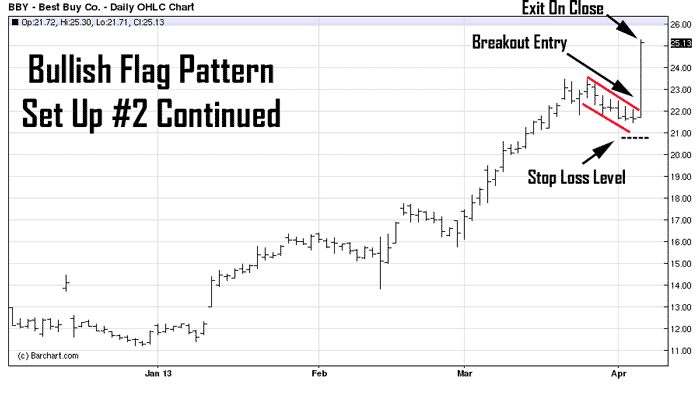
You’ll notice how low the risk level can be when the bars are consolidating before the breakout, and have a tight trading range. These are the type of patterns you want to isolate for day trading.
The risk is small compared to the profit potential and because you’re entering right after the consolidation stage, the market is primed for volatility.
The profit on this trade was close to $3 and the risk level was around $1.
Day trading unfortunately doesn’t provide opportunity for huge gains because you are limited to how much time your position has to develop.
You should look for setups that provide you with a 2-to1 risk opportunity at a minimum.
Things to Keep in Mind
Start out with simple chart patterns for beginners that make sense.
Avoid difficult formulas or calculations that involve geometry or statistics.
Look for opportunities that provide high-potential reward and low risk so that the size of your winners are at least twice the size of your losers.
The way I trade chart patterns now is completely different. I only focus on 5 that back testing shows work best.
And I actually use a scanner to find charts showing those patterns. If you want the details on how that works, make sure to watch this training session I just recorded.
For more on this topic please go to: The Best Short-Term Trading Strategy for Beginners and Why Technical Analysis Doesn’t Have to Be Complicated.
And if you haven’t done so already, subscribe to our YouTube channel so you can be notified as soon as we make our next post, and see what trade opportunities we’re paying close attention to!
All the best,
Roger Scott
Senior Strategist, WealthPress


