Unlike traditional assets, options offer traders the flexibility that comes with different calls, puts, strike prices and expiration dates.
Not to mention, the ability to create hundreds of types of spreads and combinations to take advantage of different market conditions, volatility disparity as well as seasonal tendencies.
Most options traders anticipate three types of price movements…
So I decided to separate and categorize the most common, and then select the best technical analysis methods for options trading that take advantage of each type of price movement.
Here are the three different possibilities…
Technical Analysis Methods for Options Trading: Strong Directional Movement
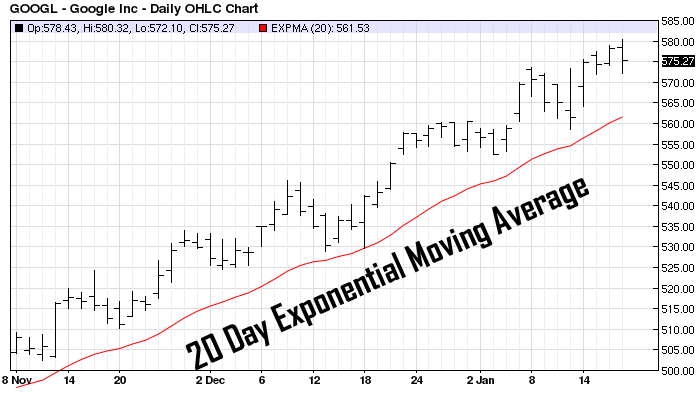
One of the best technical analysis methods for options trading when trying to find candidates moving rapidly is the 20-day exponential moving average.
The 20-day EMA is more responsive than the traditional moving average, placing more weight on recent price data. Therefore, it’s the better choice to help you gauge the strength of a trend.
Another great technical filter I use is the 90-day price high.
According to numerous backtests, assets that make 90-day price highs tend to continue moving in the same direction, often experiencing an increase in momentum.
Many traders believe stocks are priced too high when trading above 90-day price highs… But if you take a look at major price breakouts that continue for months on end, they all start out by breaking the 90-day high.
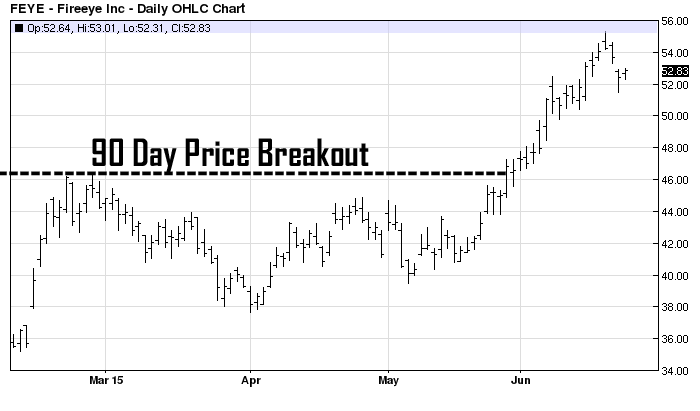
Keep in mind that the percentage of false breakouts is also lowest near the 90-day level.
Technical Analysis Methods for Options Trading: Mild Directional Movement
The second type of price movement is a mild directional movement, which results from a bounce, pullback or a continuation in momentum after a pause.
You’ll find these movements usually occur while a trend is already on the way and the market is pausing and re-balancing before once again continuing to move in the direction of the main trend.
One simple and effective method of spotting mild directional movements that work well with options is to identify assets that pull back while in a strong uptrend.
One indicator that works well for this type of analysis is the Relative Strength Indicator. I typically adjust the time period from 14 days to 10 because my time frame is shorter. But otherwise, there are no other changes that need to be made to the indicator.
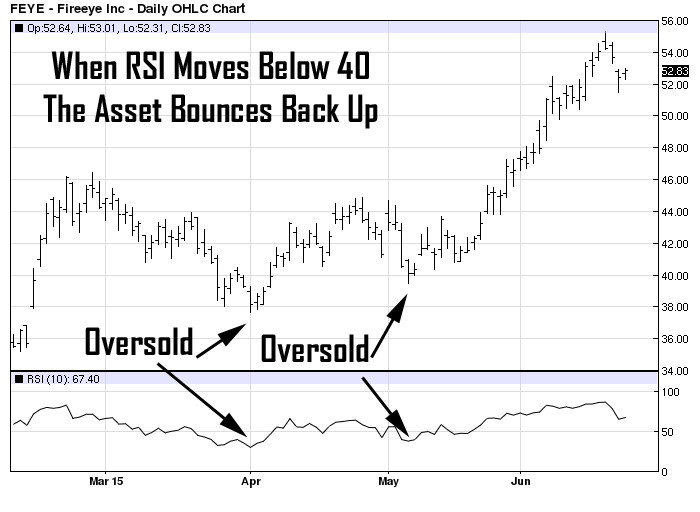
While there are other oscillators similar to the RSI, the majority of them are too sensitive to price data and generate too many false signals.
So I avoid the stochastic, MACD and other momentum oscillators, relying almost exclusively on the RSI for overbought and oversold analysis.
Mild directional movement is ideal for options spreads and other combination strategies. On the other hand, if you’re trading net long or short positions and want maximum directional movement, you may want to use the momentum strategies identified in the first section.
No Directional Movement Strategies
Most options traders — especially premium sellers — want nothing more than little to no directional movement to take advantage of premium decay.
When option writers sell premium, they also want a higher level of volatility. This increases the amount of premium that the options writer brings in due to a sharp increase of implied volatility that expands when volatility increases.
One of the best methods of identifying a range-bound market that has substantial range expansion is to use the Bollinger Band indicator.
You can see in this example how the Bollinger Bands maintain several months of price action on the S&P 500 within the upper and lower band. Notice how the envelope expands and contracts as volatility or trading range moves higher and then lower. This is a good way to determine if volatility is increasing or decreasing.
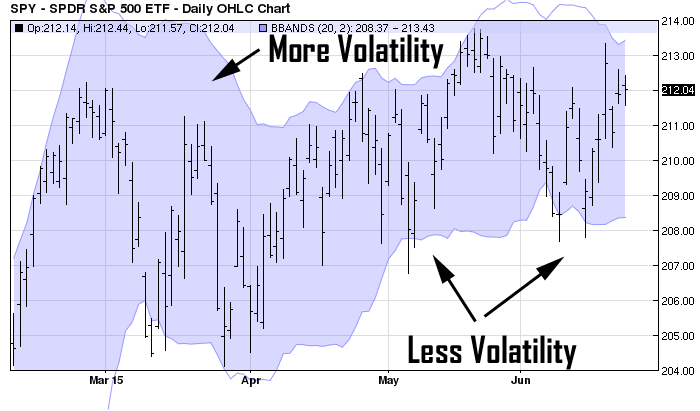
If the Bollinger Band envelope expands, then volatility increases.
If the Bollinger Band becomes narrower, then the market is becoming more range bound and volatility is decreasing. Many professional traders sell options when the bands are widening, and buy the options back when the bands are becoming narrower.
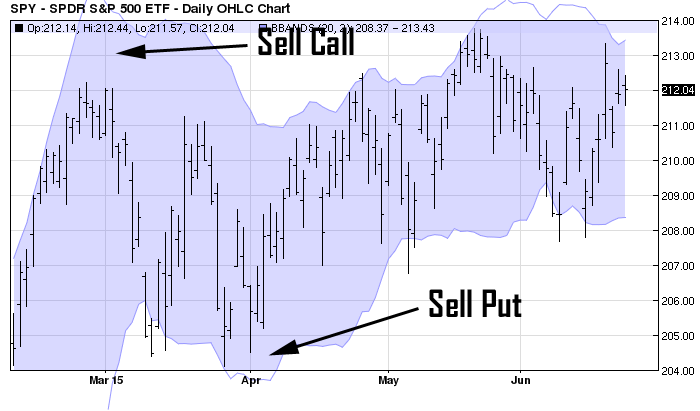
Another way to use Bollinger Band is to use them as support and resistance levels to sell premiums outside of the upper and lower bands of the envelope… These levels offer conservative trading levels to both the up and downsides.
There are different technical analysis methods for options trading and each one works best in different market conditions.
The type of indicator and analysis method you choose should take into account the type of price move you are anticipating, the options strategy you plan to use and the level of volatility in the underlying asset at the current time.
I hope that helps!
And if you haven’t done so already, subscribe to our YouTube channel so you can be notified as soon as we make our next post, and see what trade opportunities we’re paying close attention to!
All the best,
Roger Scott
Senior Strategist, WealthPress


