Dear Reader,
You need to know four things about trading this market.
They have nothing to do with the Federal Reserve… nothing to do with earnings reports. They have nothing to do with valuations… revenue… or any other metric that Wall Street analysts discuss in mainstream media.
They’re all-around momentum… and you can track what I’m about to show you – for free – any time you want.
What are the tools I use to try and beat this market?
Four things… all are momentum indicators.
Momentum is Your Friend
I don’t know why people ignore momentum as a market anomaly.
It’s one of three anomalies that cannot be arbitraged away… even in an environment where algorithms drive the trading. Buying begets buying. Selling creates selling.
The only thing that matters is the price, and whether it’s up… or down.
So, as I’m trading intraday, I’m focused on four things.
The following chart summarizes the S&P 500 ETF (SPY) and its price movement since Wednesday, January 18, 2023. The market experienced a short-term topping event that fueled a very strong selloff in a 24-hour period.
The selloff started on Wednesday at 10:30 am.
Pay close attention now to the indicators under the chart.
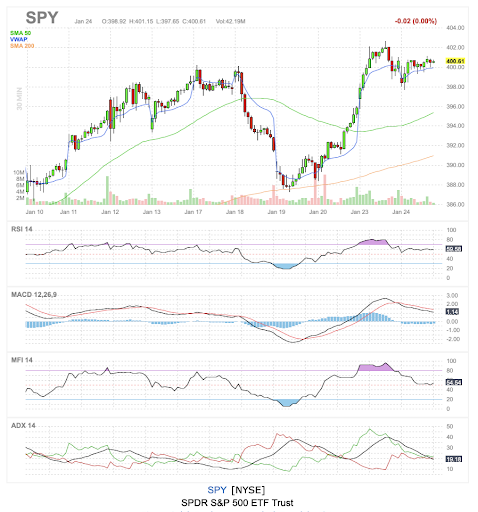
Those are known as Momentum Oscillators. They are – in order – the Relative Strength Index, the Moving Average Convergence Divergence (MACD), the Money Flow Index, and the average directional index (ADX).
The Relative Strength Index measures stock movement on price. When stocks are overbought, the reading is above 70. When stocks are oversold, the reading is under 30.
The Money Flow Index is a reading of price and volume. It measures momentum, and stocks are overbought when the indicator is over 80. When it’s oversold, the number is under 30.
The MACD measures stock movements on the exponential moving averages of two time periods. The black line drops under the red trend line when momentum breaks down. When momentum is positive, the black line moves above the red line.
The ADX is similar. It measures price divergence on a 14-day level and given that algorithms track around these indicators, a negative move tends to correlate with a selloff in the stock.
I know a lot of people who only trade one of these indicators.
Don’t do that. You need to combine all of them at once. You need to track them.
Four Deadly Venoms
The film Five Deadly Venoms says: “Toad style is immensely strong, and immune to nearly any weapon. When it’s properly used, it’s almost invincible.”
The Wu-Tang Clan raps about this moments later in “Da Mystery Of Chessboxin’” from Enter The Wu-Tang (36 Chambers).

The point is that combining these indicators can tell you about the likely movement of a stock. This is about market timing. It’s about bringing the probability of a move you can anticipate to its highest level. And it actively tracks capital flowing in and out of the market in real-time.
As you can see, the market was oversold on Thursday afternoon, prompting a large amount of bidding in this market. And on Monday, we were in overbought conditions. All of the momentum indicators dictate this.
So, how should you trade this movement? Good question. That’s what we will discuss tomorrow.
To your wealth,

Garrett Baldwin
P.S. Please let me know if you have any feedback, questions about today’s issue or anything else. Just email us at [email protected].
*This is for informational and educational purposes only. There is an inherent risk in trading, so trade at your own risk.
Market Momentum is Green
Momentum remains positive, and Microsoft’s earnings beat is another positive catalyst for this market. It’s wild to see that the market had such low expectations for the software giant and how dismal numbers can fuel a rally. This is a testament to how much money is pouring into a short squeeze, and bidding on stocks that are still OVERVALUED. And yes, MSFT is an overvalued stock, trading at a ridiculous 8.6 times sales.


