Dear Reader,
I will admit that I’m largely a market bear. I blame rationality.
I look at this nation’s underlying economic situation and wonder why investors would start buying stocks at even higher valuations (I’ll also blame the algorithms). If we had any rational attachment between the U.S. economy and the stock market, we’d be far lower.
But the machines don’t know that housing has been crushed. And the machines don’t care that durable goods spending is ugly. Meanwhile, the Perma bulls are in the business of buying for $1 and selling for $2.
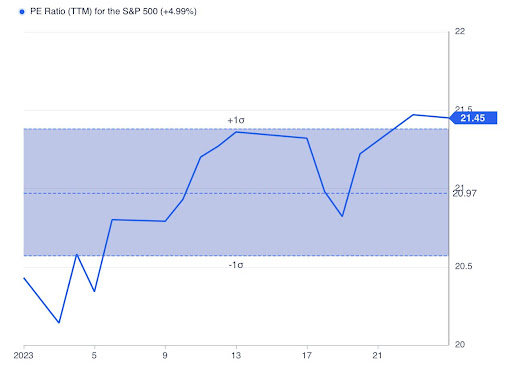
In the last three weeks, since my momentum indicator turned positive on January 6, the PE ratio of the S&P 500 jumped from 20x to 21.5x.


People are paying more than 5% more for the same earnings. That – on the surface – is madness.
Perhaps the narrative is changing, and the market is pricing in disinflation and not a recession, but whatever we see right now feels like a delusion. It’s a good thing that I have a strategy to address this manic condition.
A Line in the Sand
The markets follow a trend.
Since November 2021, it has centered on the Federal Reserve’s need to squash inflation at any cost. And they are doing so at a breakneck pace that is almost getting uncomfortable.
As I noted, the economy would start to slow down at a face pace. Q4 Core GDP was 0.6%, while combined housing and durable goods spending were off -5.5% (which feels like a shadow recession to me).
That said, the market trends shifted in October, as the S&P 500 found its bottom. And it produced an interesting result…
The trend since October was a higher run into the December meeting, followed by a move down to a support level on the S&P 500 around 3,800.


You can see the pink line as the primary top channel support going back to April. That line extends all the way under the market tops of January as well.
Meanwhile, that bottom blue line support had been the trend in this market. It appeared in December that we’d witness another reversal – before the market found support to start the year.
As you can see, there’s a wedge pattern that builds pressure from one side and downward pressure on the other.
And now, as we listen to the Fed’s speech on February 1, the central bank’s decision will decide which way this market turns.
Will we break out of the yearlong trend as the bears are expecting… or will we crack above the 4,100 lines on the S&P 500 and melt up?
Green for GO
Luckily, I follow Momentum. So, I honestly don’t care. I’m simply aiming to react to the market, buy stocks when conditions are Green (like after January 6), or get out of the way if it goes Red (like December 12).
Even if I expect this market to implode due to underlying economic weakness (although the government is dropping more liquidity out of the sky), I put that bias aside in positive momentum conditions.
Meanwhile, I’ve built a long-term portfolio that benefits no matter what comes in the months and years ahead. And next week, I’ll unveil my February pick in a company with a very unusual growth story for the years ahead.
I’ll attend this week’s Live Roundtable with Don Yocham on Wednesday, Feb. 1 at 10am ET, where I’ll talk about the company. Just go here to watch it then.
To your wealth,


Garrett Baldwin
P.S. Please let me know if you have any feedback, questions about today’s issue or anything else. Just email us at hubfeedback@wealthpress.com.
*This is for informational and educational purposes only. There is an inherent risk in trading, so trade at your own risk.
Market Momentum is Green
Momentum is at a peak as markets remain extremely positive and investors continue to squeeze higher into the top of the channel. This is the strongest momentum we’ve seen since August, but a sense of FOMO has sucked the air out of the room. And we’ll see what happens with the trend when the Fed meets next week.


